Getting answers from CloudWatch Logs Insights

CloudWatch Logs Insights enables you to interactively search and analyse your log data in Amazon CloudWatch Logs.
1. Why use CloudWatch Logs Insights?
- Easy integration with other AWS services
- Automatic field discovery from JSON logs
- Purpose-built query language
- One less service to integrate
AWS services can be configured to ship their logs to CloudWatch Logs. That makes Insights a sensible choice without having to worry about setting up additional services.
Many log services have an overly simplified query language or a painful to use, slow UI. CloudWatch insights's query language is powerful enough to ask complicated questions of it.
2. Capabilities
CloudWatch Logs Insights automatically discovers JSON keys in lines logged from Lambda logs. It works by searching for the first JSON fragment in each log event.
If a Lambda log event contains multiple JSON fragments, you can manually parse and extract the log fields by using the parse command, which you can read more about here. We will assume for the examples below there is a single JSON fragment.
The query language is lightweight. We will run through a couple of the key capabilities:
- Filter
- Stats
- Sort and Limit
- Display and Fields
Quick and dirty examples
I love to give examples on what the tool looks like early. This will give the rest of the information context.
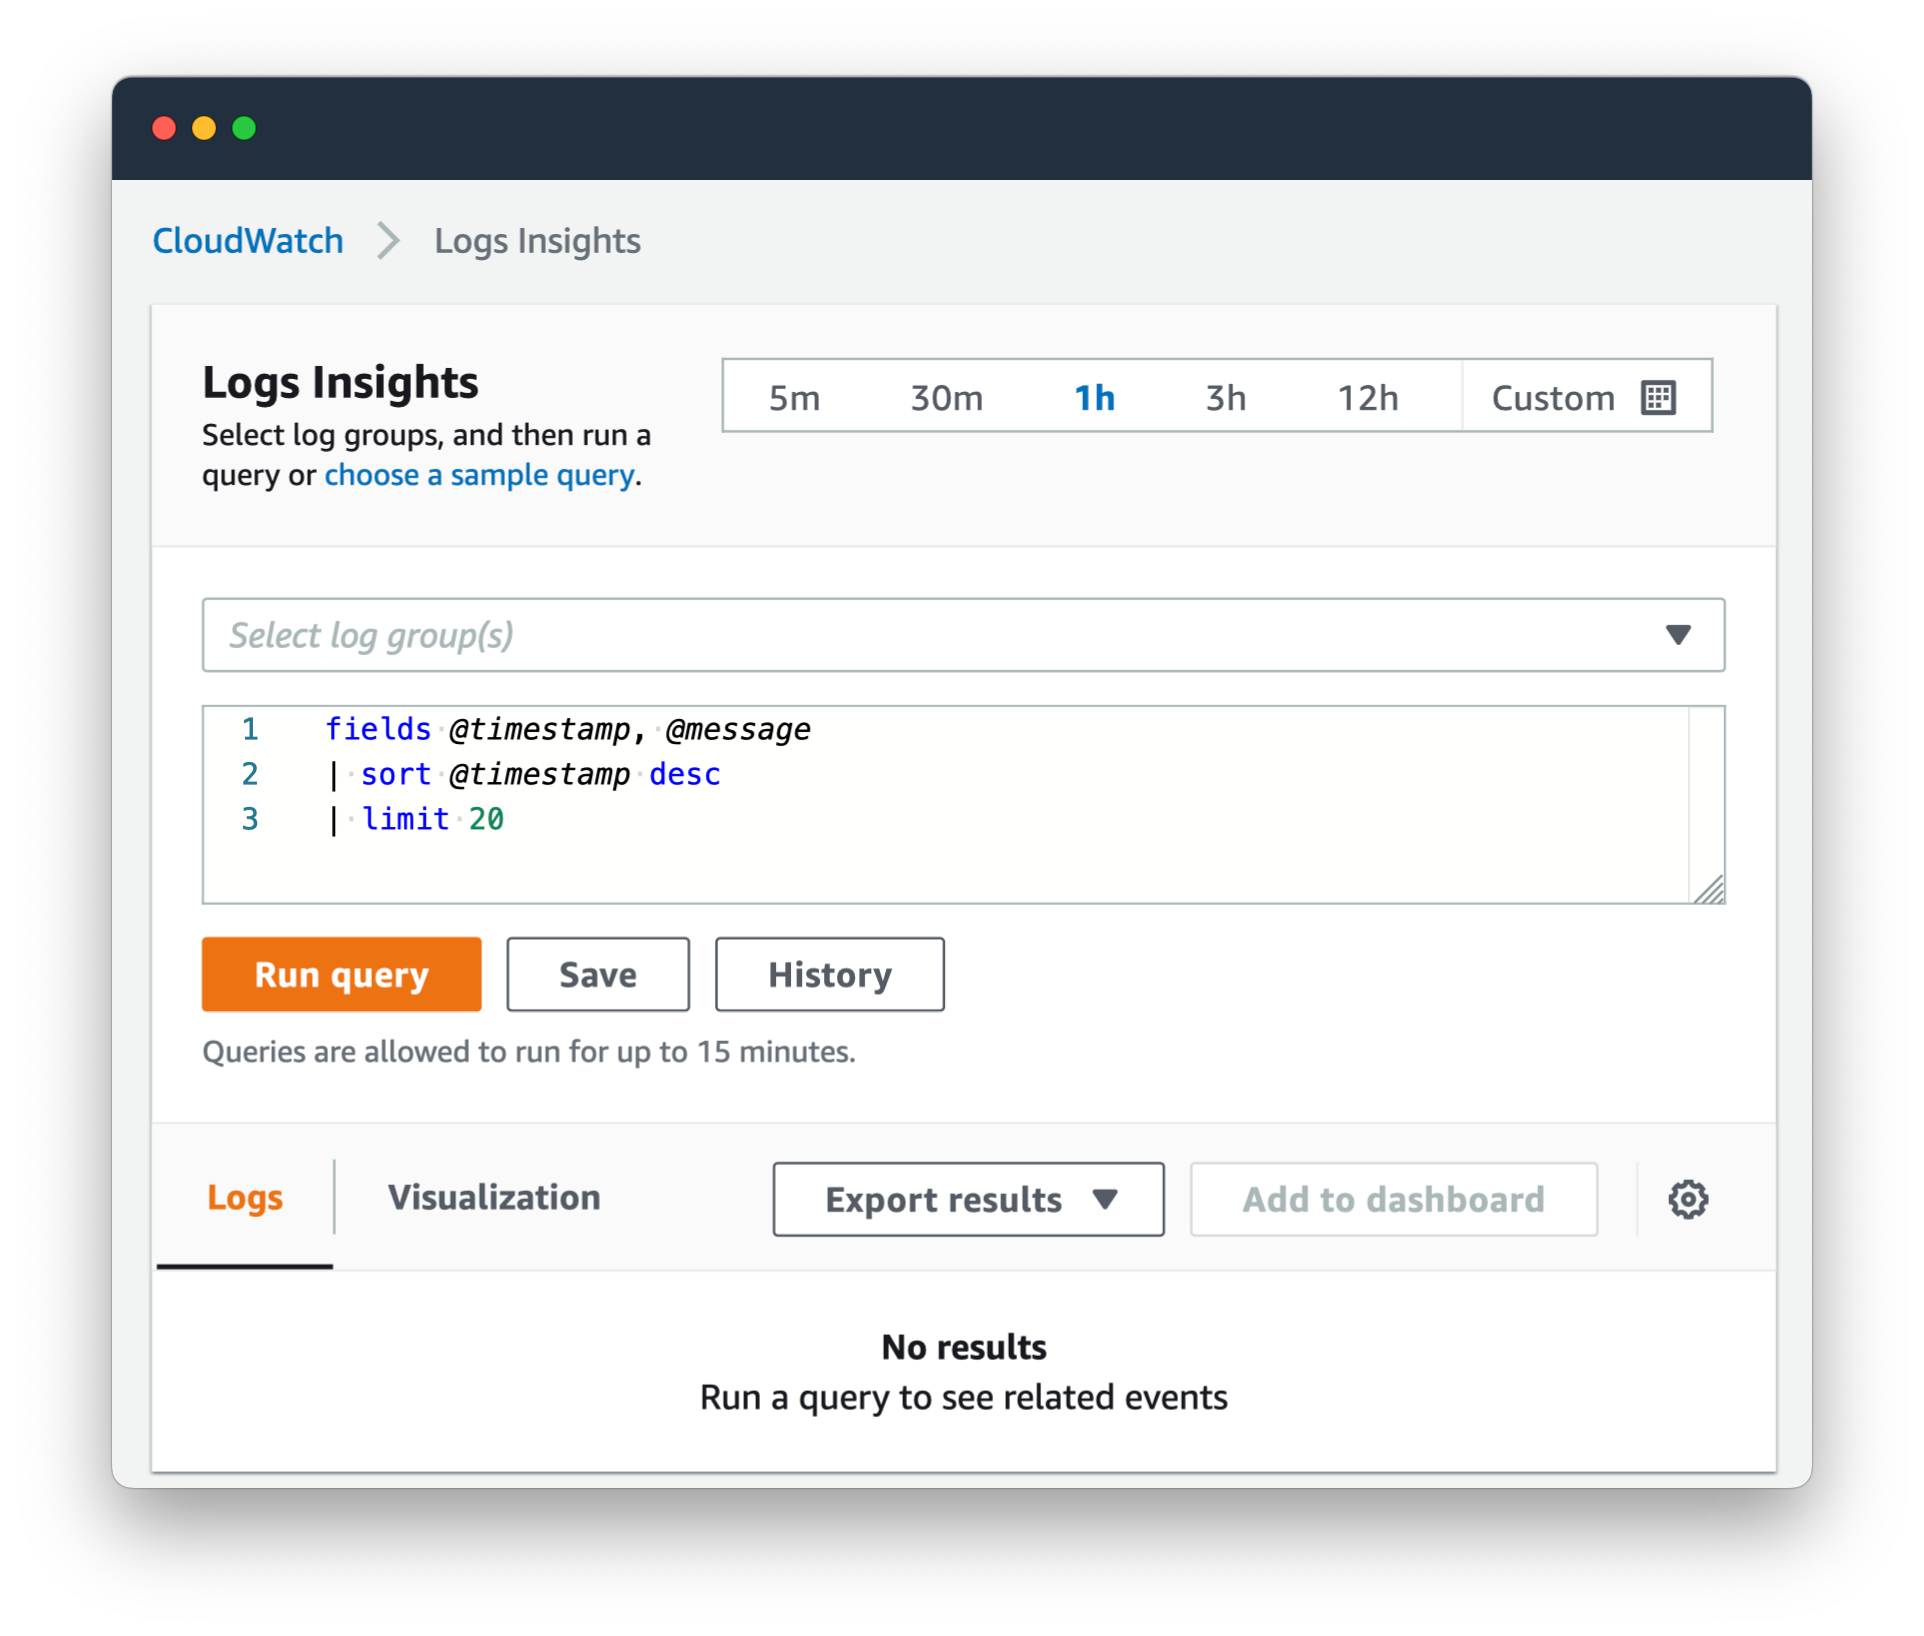
The way it works,
-
You select your Log Groups, as many as you want.
-
Check your date range up the top. Start small, like the last
1hof logs, to save on cost while refining your query (more on that below). -
Start with a simple query to get an idea of what you are looking at, like:
limit 20 -
Refine the query from there, adding commands like
filter,statsandsort.
Here are a few finished queries to give you an idea of how they look at the end:
Example 1: Find all logs that have a 50x error, or a log message that sounds like an error or a timeout. Aggregate the results by the @log group, the message, and statusCode, then count the distinct sessionId's and the total count of errors in each bucket. Finally, sort by totalCount of errors.
filter statusCode like /50/ or message like /[Ff]ailed/ or message like /timeout/ or message like /[Ee]rror/
| stats count_distinct(sessionId) as sessionCount, count(*) as totalCount by @log, message, statusCode
| sort by totalCount desc
Example 2: Display the error and statusCode for log lines that have an error key in the first JSON fragment of the log line.
fields error, statusCode
| filter ispresent(error)
Example 3: Display the entire log, and timestamp, of the most recent 20 log lines. Remember this is scoped to the time range that you specify in the UI.
fields @timestamp, @message
| sort @timestamp desc
| limit 20
See the official documentation on AWS for more examples.
Filter
filter is the bread and butter of a query. It uses SQL-esqe terms such as like and not like. You can use regular expressions or text matches.
Examples:
-
Filter out all terms in the first JSON object, that have the key "
message" and whose value matches the regex/Recaptcha response/.filter message not like /Recaptcha response/ -
You can add multiple queries using
andfilter message like /Recaptcha Failed/ and message like /timeout-or-duplicate/ -
You can daisy-chain filter usage. The below query is the same as the above one.
filter message like /Recaptcha Failed/
| filter message like /timeout-or-duplicate/
Stats
stats is how multiple lines are aggregated into a sensible summary. Within stat you can perform SQL-esqe count's and a grouping using by.
Examples:
-
Count the number of distinct
requestId's in the logsstats count_distinct(requestId) -
Combine the above with a filter
filter statusCode like /50/ | stats count_distinct(requestId) -
Group log counts by IP address
stats count(*) by requestIP -
Filter those counts to show those that made more that 10 log lines
stats count(*) as request_count by requestIP | filter request_count > 10 | sort by request_count desc -
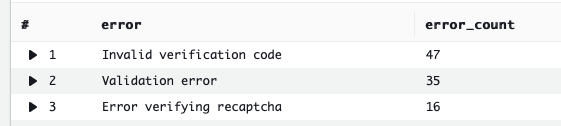
Filter all log lines to those that include the key "error" in the first JSON object. Display the full list of error messages with totals next to them.
filter ispresent(error)
| stats count(*) as error_count by error
| sort error_count desc
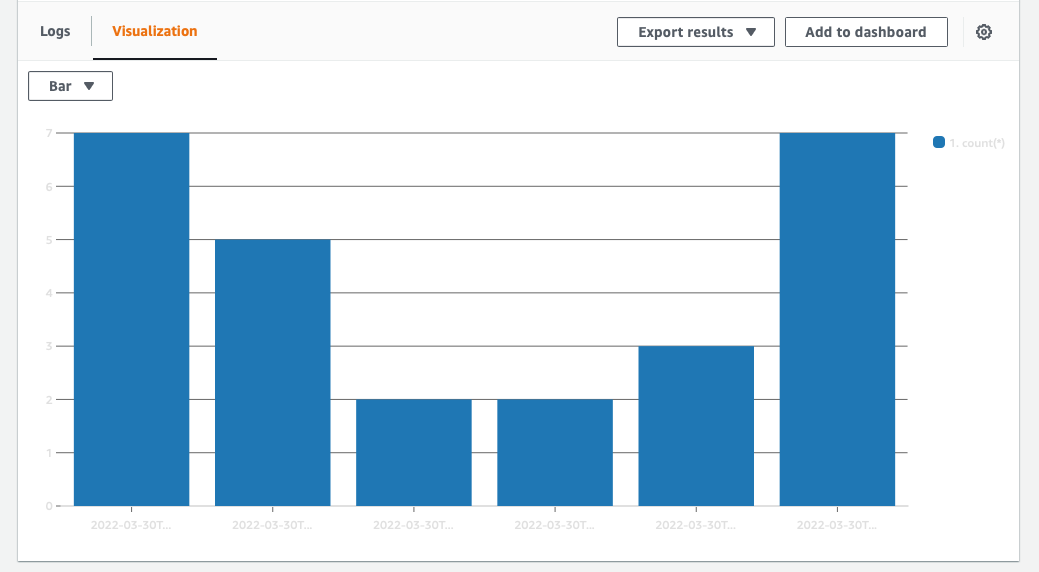
When using the stats command, it is possible to group results. To do this we use bin.
Below is an example using bin to group results into a time series visualisation which can be graphed using the "Visualisation" tab.
filter ispresent(error)
| stats count(*) by bin(30m)
Sort and Limit
sort and limit are what they sound like.
With sort you can add asc or desc to control the order. For example, your log will likely have a timestamp. You could sort like this:
sort @timestamp desc
limit is another simple one. Limits the number of log events returned. Useful to keep your bill down when trying to work out the correct query to run.
limit 20
Display and Fields
display and fields are similar, and the documentation is vague as to the cost difference between them.
My read is that fields restricts the data to a subset before subsequent operations, which saves you money. display filters the results at the end of the query.
Examples, assuming you have a JSON fragment in your log with two keys: fieldA and fieldB:
Example 1: Return fieldA and fieldB where fieldA matches the string "error",
fields fieldA, fieldB
| filter fieldA like /error/
Example 2: The same response as Example 1, but using display instead,
filter fieldA like /error/
| display fieldA, fieldB
My interpretation is that Example 1 is more efficient, as it restricts the amount of data being operated on earlier in the query.
3. Cost
Pricing is based on usage. Insights' queries incur charges based on the amount of data that is queried. It's free tier is lumped in with CloudWatch logs:
The free plan gives you 5GB Data (ingestion, archive storage, and data scanned by Logs Insights queries).
After that you pay per GB of data Collected, Stored and Analysed.
For an application doing 670k API requests and generating 3M log events per day it would cost (in USD):
- $0.335 to ingest all the logs for a day
- $0.0165 per day to store 1x days worth of logs. For a rolling 30 day period, this would cost 30x $0.0165 daily; roughly $0.50 per day.
- $0.004 to run a query that scans across all logs for that day.
This adds to roughly $25USD per month, with query usage billed on top of that, which might be an additional $15USD depending on your usage and your consideration towards cost when running queries.
Insights is powerful, but you could rack up a considerable bill if you were not mindful of the pricing structure when writing queries. It will happily process gigabytes of logs and then send you the bill after.
Summary
Today you have learned the surface of what is available through CloudWatch Logs Insights. It is important to consider what data your application is logging and why, then once you have have that data, make sure you use it!